
Executive Summary
- √Ethereum is sitting at the 2,000-support level, previously during the summer of 2021, this was an attractive level to buy
- √US economic data continues to weaken, and companies are indicating that they are currently overstaffed (Walmart, Amazon) – there is a possibility that US rate hike expectations are reversing
- √Implied at-the-money volatility has shot up from 60% to 156% for Ethereum during the last week, with volatility dropping back to 80%
- √Crypto futures option interest has spiked, a sign that many market participants have hedged their exposure – an unwinding of those positions could result in bullish support for the market now
- √Year-to-date, the gaming sector has done the worst (-77%) with play-to-earn Axie Infinity tokens losing -78% while NFT floor prices are stable
- √A change in Luna’s Anchor yield incentive has started the cascade, among other things – we investigated and added a few observations
- √Total Locked Value (TVL) dropped by $80bn during the last week, combined with Tether’s market cap (dropped by $7bn) – those are the two indicators we are monitoring now to see ‘trust’ in DeFi being restored
Exhibit 1: Ethereum Sitting at 2,000 support level
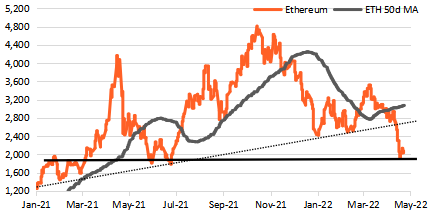
Source: Binance, IDEG Research, May 17, 2022
Macro
Inflation risk might slowly be replaced by growth risk as the evidence of slower global growth increases. Lockdowns in China have halted manufacturing and exports, while higher energy prices put pressure on Europe’s economies and rising interest rate expectations in the US have changed the growth outlook there as well. Suddenly, US tech companies are indicating layoffs, despite talking about labour shortages just a few months ago. Walmart and Amazon both mentioned overstaffing in their Q1 earnings calls. Inflation is impacting retail sales.
While the US Manufacturing PMI has dropped to 55.4 in April from 57.1 in March, the leading ISM New Orders Index points to a slower growth level of just 53.5 – a sign that the US economy is close to ‘neutral’ (50.0) – a level where the US economy is neither growing nor contracting. The ISM Manufacturing indicator started to decline from 61 in November 2021 – the same month when expectations for US rate hikes accelerated and subsequently cryptocurrencies peaked out.
The US 10-year bond yield has been trading around the current 2.95% level for a whole month now and without another push way above the 3.2% level, the bond market might start to price in the next easing cycle.
Ahead of the US Mid-Term elections in November, the US government might start another round of fiscal support to compensate voters for their higher energy (inflation) costs. Similar to the March 2020 Covid fiscal support when Bitcoin started the rebound from 5,000 to the cycle high of 69,000.
Exhibit 2: US 10yr Treasury Yield
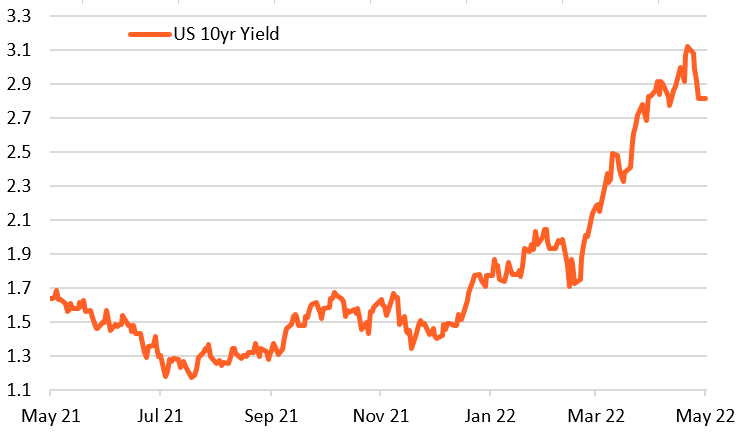
Source: YahooFinance, May 13, 2022
Flow Trading
At-the-money implied option volatility rose from 60% to 130% on May 12th, before dropping back to 80% on May 13th on Friday. Currently, there is still 15 vol points higher implied volatility priced into ATM options than before last week’s price adjustment. $1.5bn notional option value will run off with the expiry on May 27th – equally split between calls and puts. This should lift the overhang of put options and could help a move higher in spot prices.
ATM implied volatility for Ethereum rose from 60% to 156% and has since dropped back to 80%. We previously mentioned that buying Ethereum vol at the same level as Bitcoin could result in a ‘cheap’ hedge as ETH vol tends to trade at significant premiums during market stress. Buying 80% strike puts on ETH while selling 80% strike puts on BTC with the same maturity would have been the winner (for zero premium). Picking up 26% (implied) vol points is indeed not a bad hedge (156% ETH vol – 130% BTC vol).
While crypto is a 24 hours / 7 days / 365 days market, there was a very short window on Thursday May 12th when liquidity was handed over from (South) Korea to Europe. During those 90 minutes when the stock market in Korea closed for the day and before stocks opened in Europe (6:00am to 7:30am coordinated universal time), crypto futures markets came under severe stress. This brief window of dislocation offered great trading opportunities.
CME option volume trading increased from 153 contracts on Friday, May 6th to 552 options on Monday, May 9th while futures volume increased from 6,300 to 14,000 (Friday 6th to Monday 9th) with volume peaking on Wednesday May 11th with 21,500 contracts being traded ($3.3bn).
Interestingly, CME introduced a new ‘Micro Bitcoin Futures’ where volume was elevated on Wednesday (similar to the larger, institutional Bitcoin contract (with $150k notional, value of 5 BTC) but peaked out on Thursday May 12th. A sign that retail ‘hedged’ potentially beyond the actual panic low on Thursday (morning) and therefore smaller contract traders (retail) might be more exposed to any price reversal (short-cover risk).
CME Ethereum futures were also elevated on Wednesday AND Thursday and peaked at 3x normal volume ($1.3bn per day or 13k contracts vs. 4k on average days).
Order was restored when ‘traditional finance’ equity futures started to trade in Europe. Hence, those dislocation opportunities quickly evaporated but it also showed a quick turnaround in negativity in the market.
As an industry proxy, Coinbase reported Q1 ’22 trading volume of $309bn vs. $355bn a year earlier. Retail trading volume declined -38% to $74bn while institutional volume grew +9% to $235bn. The split between institutional (76%) vs. retail (24%) trading volumes highlights how changes in traditional finance instruments are more and more driven by institutional investors which tend to make decisions based on the cost of capital (allocation based on interest rate changes) instead of just looking protocol prospects.
This is why digital asset performance has recently been highly correlated to traditional asset prices, such as US Tech stocks, and also why a peaking out of US bond yields might signal an important turning point for crypto assets.
State of the Digital Asset Market
The global crypto market cap today is $1.37trn, a +1.2% change in the last 24 hours and 4.3% during the last 1 week. Total crypto trading volume (24h) was $89.4bn (decrease of -57.7% last 1 week). Total Value locked (TVL) stands at $112.4bn, this is an increase of 1.3% (24h) and -12.7% over the last 1 week.
1-week: $m TVL inflows best: Tron (TRON) $50m, Kava (KAVA) $34m, Klaytn (KLAY) $7m; worst: Ethereum $-840m, Fantom (FTM) $-290m, Avalanche (AVAX) $-280m. Revenue creaters (5d, in mln): Ethereum $115.2, Convex Finance $12.5, Binance Smart Chain $9.2, PancakeSwap $14.1, Lido Finance $5.7, Avalanche $3.3
Crypto futures saw $48m BTC liquidations (24h and $359m in last 5d), while ETH saw liquidations of $29m last 24h (and $215m in last 5d). Futures: BTC seeing 0.7x lower liquidation than avg. days ($48m vs. $71m), ETH seeing 0.6x lower liquidation than avg. days ($29m vs. $50m).
Bitcoin dominance is at 42.3%, Ethereum chain dominance at 64.3%, followed by BSC (BNB) with 7.8% and Avalanche (AVAX) with 4.6%. NFT market cap (top 100 projects) stands at 3.33mln ETH or $6.94bn, an increase of 8.7% over the last 1 week.
Digital Asset Ecosystem
Similar to traditional finance, digital assets can be broken down within sectors and industries. With Bitcoin prices have declined -35% year-to-date, we can easily see which industries and sectors are out-and-under-performing. Notably, NFTs have been holding their ‘value’ while gaming has seen the largest YTD price adjustment. Play-to-earn Axie Infinity has dropped -78% YTD with Bored Ape Yacht Club has traded back to 100 ETH floor price.
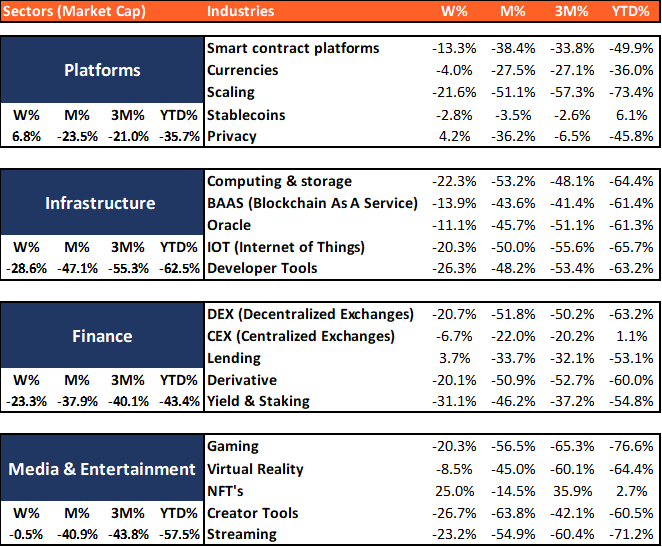
Source: Binance, IDEG Research, May 17, 2022
The Collapse of Luna
In February 2022, the Anchor protocol almost ran out of ‘yield incentives’ to pay Luna stakers as the protocol was losing reserves by $1.3m per day. With reserves of just $12.6m, it was just a matter of time until ‘investors’ would redeem their tokens and swap them into other assets.
Go big or go home was the mantra and the Luna Foundation Guard (LFG) set up a $450m buffer and the LFG estimated that those funds would be able to bridge over the money market fund incentives for another 47 weeks (January 3rd, 2023) when they believed revenues would finally be higher than payouts.
Exhibit 3: Anchor Yield Reserve ($mln)
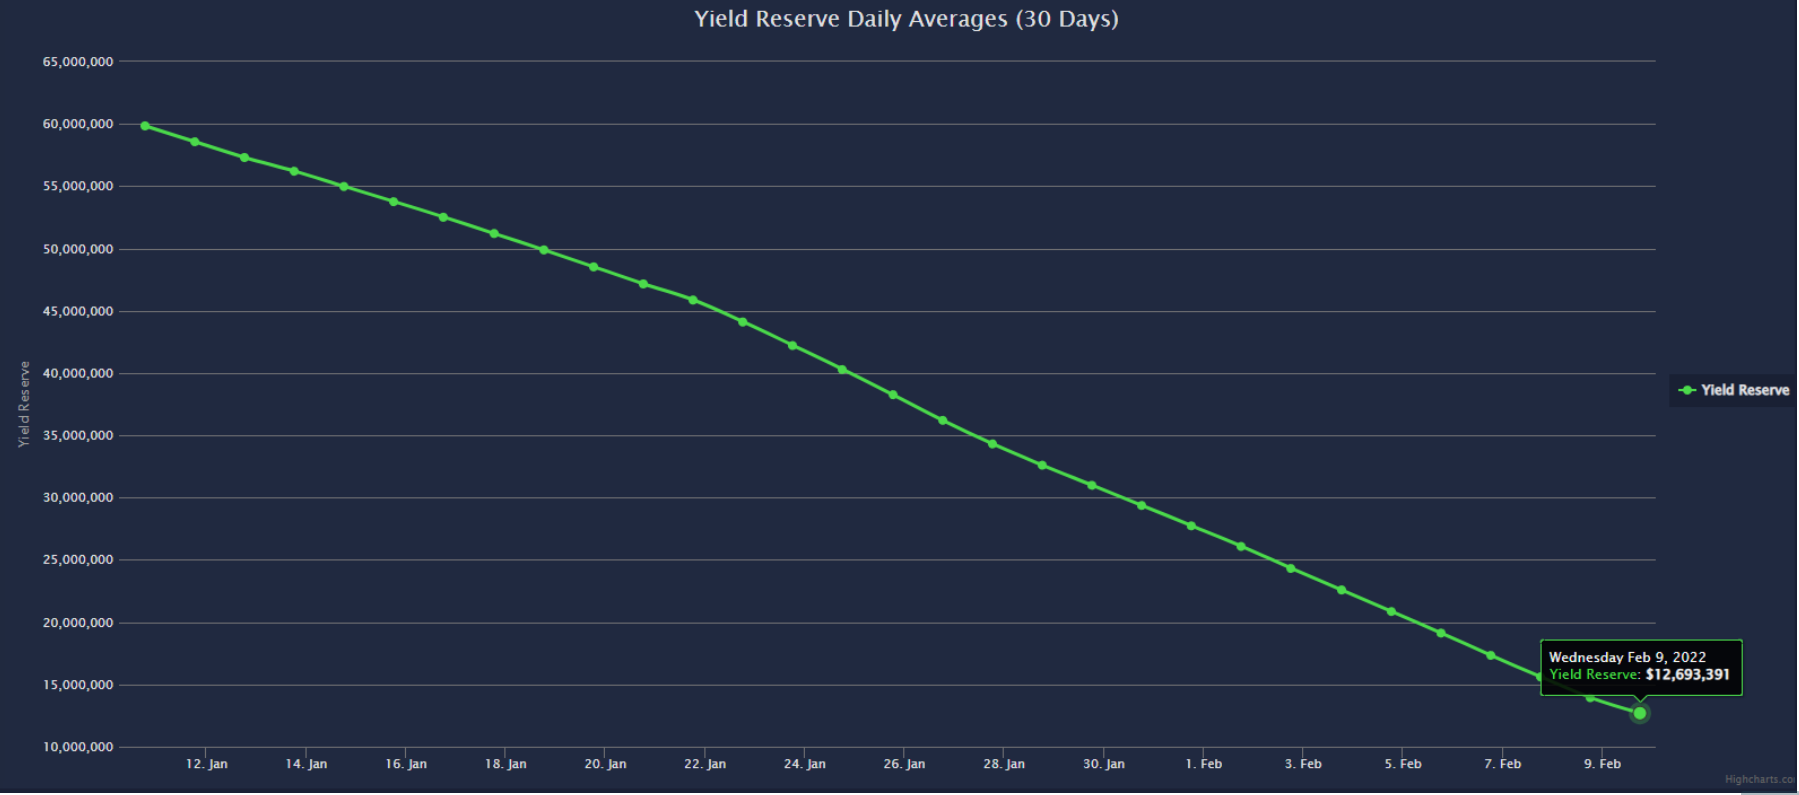
Source: Mirror Tracker, Feb 9, 2022
LFG announced on Mar 22nd to use $3bn of funds to buy Bitcoin. Eventually, this was flagged to be $15bn to diversify the collateral of UST stablecoin and seen as a major ongoing buying program for Bitcoin.
On April 1st, LFG also announced a new liquidity 4pool (with FRAX, fractional stablecoin) on the curve which was expected to drain liquidity from 3pool. For that, the LFG planned to move UST over from 3pool to 4pool, temporarily destabilizing the weighting within the pool.
3pool liquidity removal around April 20th, unbalanced the pool temporarily (UST withdrawal) with the pool being (almost completely) drained as of May 7th (leaving UST left in the pool).
To generate demand for UST, Terraform Labs set up the Anchor protocol, a money market for Terra tokens, offering a 19.5% yield. At its peak on May 5th, the protocol held a TVL of $17.2bn (currently just $1bn).
Anchor’s true yield might have been only 8% with the rest coming from Anchor’s yield reserve. From April 12th, the reserve assets dropped from $311m to $177m on May 8th ($4.5m paid out to attract /generate demand on UST).
As of May 1st, the Anchor Protocol switched from a fixed 19.5% annual percentage yield (APY) to a reward system to a semi-dynamic 18% APY (approved via Proposition 20 on March 24th 2022). Total borrowed vs. total deposits on Anchor showed a significant divergence, depleting the protocol’s yield reserve. Historically, when ‘yields’ are lowered, opportunistic yield seekers move quickly to other protocols.
Exhibit 4: Anchor Yield Reserve ($mln)
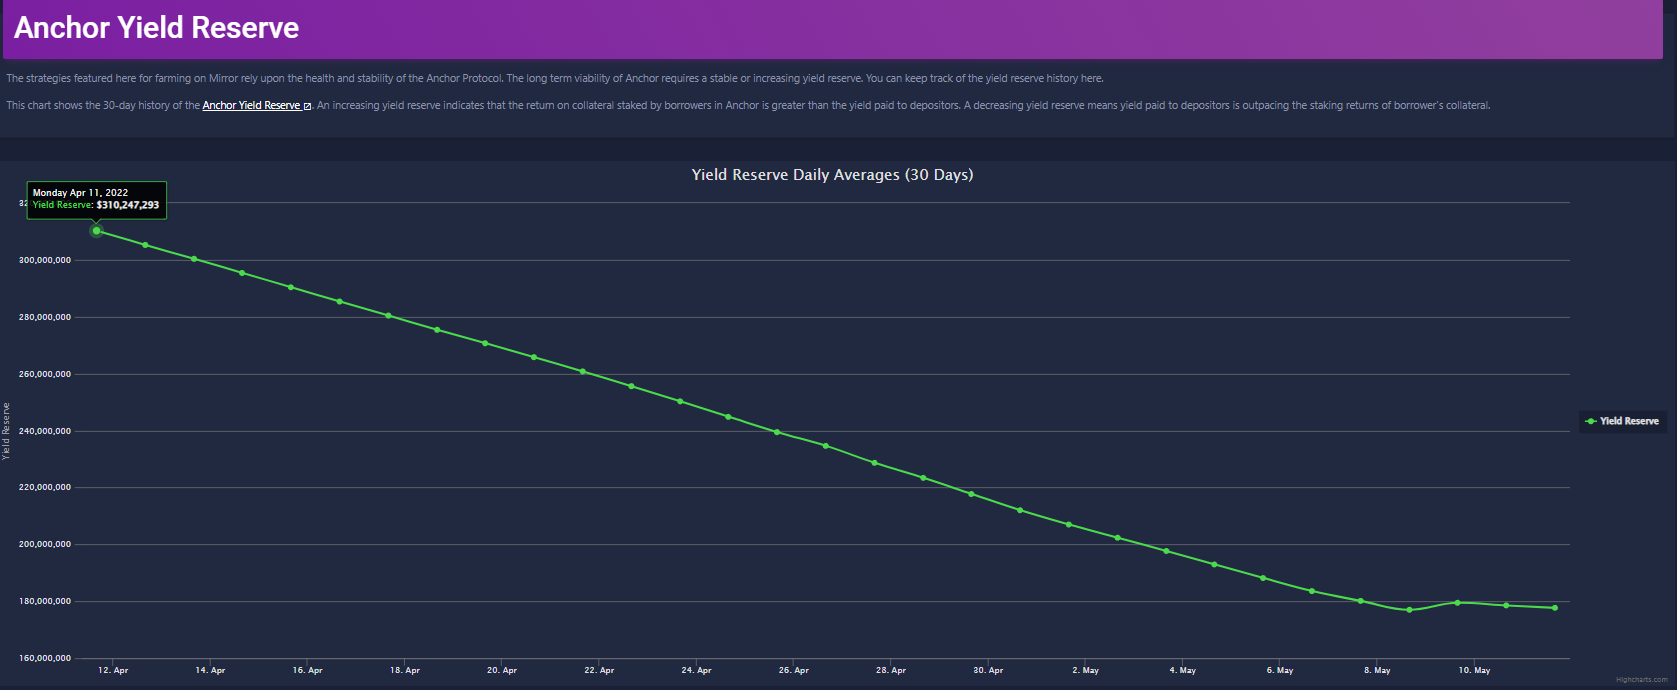
Source: Mirror Tracker, May 10, 2022
NEAR (April 25th) and TRON (May 5th) also started to advertise their protocols with 20% and 30% APY, respectively. Naturally, some money started to move over to those stablecoins.
Luna peaked out on April 5th at $41bn and stood on May 7th at $28bn (those $28bn are now lost). Similar to 3pool on curve, 4pool starts to be drained by other stablecoins than UST from May 7th (Saturday) onwards, leaving the pool with 80% of UST.
On Sunday, May 8th, the market was hit with $285m of UST supply, the market started to worry about the peg of the stablecoin. In our Monday morning comment, we pointed out that Terra (Luna) has lost $5.4bn in TVL (back then TVL stood at $23.7bn.
While TVL held steady between $26-$32bn range during the last two months, TVL has not kept pace with the market cap, signalling that the rally in Luna might not have been sustainable as the ratio kept dropping since the early march peak (purely using the TVL / mkt cap measure). 53-55% of all the Luna tokens were staked, indicating that the actual usage (besides ‘yield harvesting’) was quite low.
Subsequently, the LFG used $1.5bn of its reserves to defend the peg ($750m given to market makers [which would sell BTC] and $750m to buy back BTC after the volatility). But as mentioned above, TVL started to leave as confidence was tested.
Interestingly, the LFG completely drained their reserve wallet from all the Bitcoin (-42k BTC) by May 10th already – adding to the uncertainty about defending the peg. Especially since Bitcoin prices dropped from $42 when LFG bought them vs. $34k when they sold them ($300m loss).
Going forward, we would focus on two ‘indicators’ to judge if ‘trust’ comes back into the Defi space. Number 1: Total Valued Locked (TVL) needs to rise again. TVL topped out last November 2021 at $250bn and gradually declined to $200bn before dropping off to just $110bn. The majority of this move is due to the Luna/UST collapse. Number 2: Market Cap of Tether, which has dropped from $83bn to $76bn.
Exhibit 5: Tether Volume $bn and Tether Market Cap $bn
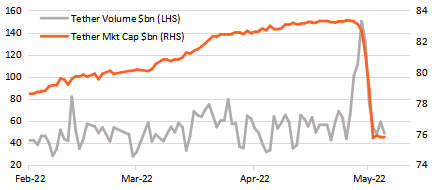
Source: Coingecko, May 17, 2022
Exhibit 6: Total Value Locked ($bn TVL) vs. 20d MA
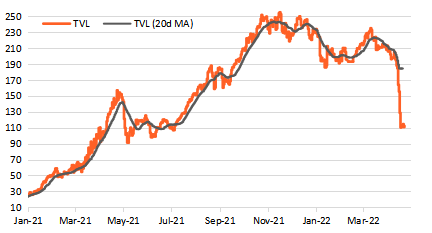
Source: Defilama, May 17, 2022